-
Type:
Bug
-
Resolution: Works as Designed
-
Priority:
Major - P3
-
None
-
Affects Version/s: 1.6.0, 1.6.1
-
Component/s: None
-
None
-
Environment:Ubuntu 18 / x64
Mongo server 4.0.14
-
None
-
None
-
None
-
None
-
None
-
None
-
None
We noticed our oplogs on some clusters were spending orders of magnitude more GB/hour despite similar traffic and lower scale; all are on the same mongod version, using same host OS platform, and all were similar hardware, but we found that the clusters that were impacted were all running the PHP Extension 1.6.0 and the cluster that was fine was still on 1.5.5.
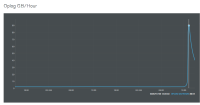
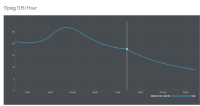
As an experiment we upgraded the known-good cluster to 1.6.1 and the change to the op-log was dramatic – we went from under 1GB/hr to close to 100GB/hr before we hastily down-graded. See attached screen-capture from the monitoring software.
Convinced we had found the difference we down-graded the 1.6.0 clusters as well and saw the average GB/hr slowly start to dwindle; I think it'll take quite some time for that average to settle so posting a picture won't be as exciting just yet.
Preliminary investigation suggested that the oplog was being flooded with "no-op" records containing the entire document updated:
{
    "ts" : Timestamp(1578321176, 5387),
    "t" : NumberLong(7),
    "h" : NumberLong("6027878811455725704"),
    "v" : 2,
    "op" : "n",
    "ns" : "lotus.accounts",
    "ui" : UUID("30e2da0f-6bbc-49e0-8578-f681ce6a6bfa"),
    "wall" : ISODate("2020-01-06T14:32:56.689Z"),
    "lsid" : {
        "id" : UUID("53985818-7a52-4ba3-8545-dc00bb6d240b"),
        "uid" : BinData(0,"47DEQpj8HBSa+/TImW+5JCeuQeRkm5NMpJWZG3hSuFU=")
    },
    "txnNumber" : NumberLong(312101),
    "stmtId" : 0,
    "prevOpTime" : {
        "ts" : Timestamp(0, 0),
        "t" : NumberLong(-1)
    },
    "o" : { ..... gigantic json block ..... }
}
I can't exactly send you the oplog because it has client-data in it but since I have 300GB of backlog that should be written at a few hundred mb/hr I might be able to fish for clues before it expires.
- related to
-
SERVER-45442 Mitigate oplog impact for findAndModify commands executed with retryWrites=true
-
- Closed
-

