-
Type:
Bug
-
Resolution: Done
-
Priority:
Major - P3
-
Affects Version/s: None
-
Component/s: WiredTiger
-
Fully Compatible
-
ALL
-
None
-
0
-
None
-
None
-
None
-
None
-
None
-
None
Running sysbench shows the following timeline:

- At A the cache has reached its configured limit (actually 85%, I believe). At B the insert phase of the benchmark ends and the update phase begins.
- Second row shows allocated bytes as reported by tcmalloc. Per documentation I believe this is the bytes as requested by the app so does not include any tcmalloc overhead. This reaches approximately 6 GB.
- Third row shows bytes in cache as reported by WT, which reases 5 GB, about 20% less than the allocated bytes.
- Last row shows difference between bytes in cache and allocated bytes. This grows in proportion to the number of bytes in the cache at a rate of about 20%, and stops growing at the point where bytes in cache stops growing. This suggests that WT allocates about 20% more bytes than are accounted for in the "bytes currently in cache" statistic when it is doing inserts.
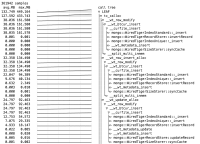
Call stack data was obtained by using perf to monitor calls to all tmalloc entry points. Here's a partially expanded reversed call tree for a shorter run up to 449 MB bytes allocated by WT. Timeline shows currently active memory (i.e. accounting for both allcoate and free) charged to each call site over the course of the run. Read max bytes active throughout the run for each call site from the "max.MB" column. Full call tree attached as well.

- is depended on by
-
WT-1901 Issues resolved in WiredTiger 2.5.3
-
- Closed
-
- is duplicated by
-
SERVER-17421 WiredTiger b-tree uses much more memory than wiredTigerCacheSizeGB
-
- Closed
-
-
SERVER-18231 Primary is unable to be reached when secondary does fullSync
-
- Closed
-
-
SERVER-18241 MongoDB 3.0 + WiredTiger process uses more cache memory than specified
-
- Closed
-
- related to
-
SERVER-16977 Memory increase trend when running hammar.mongo with WT
-
- Closed
-
-
SERVER-17456 Mongodb 3.0 wiredTiger storage engine memory usage too high.
-
- Closed
-
-
SERVER-17495 Stand alone mongod throughout dropped by 40% after 17 hours of insert only workload
-
- Closed
-
-
SERVER-17386 Cursor cache causes excessive memory utilization in WiredTiger
-
- Closed
-


