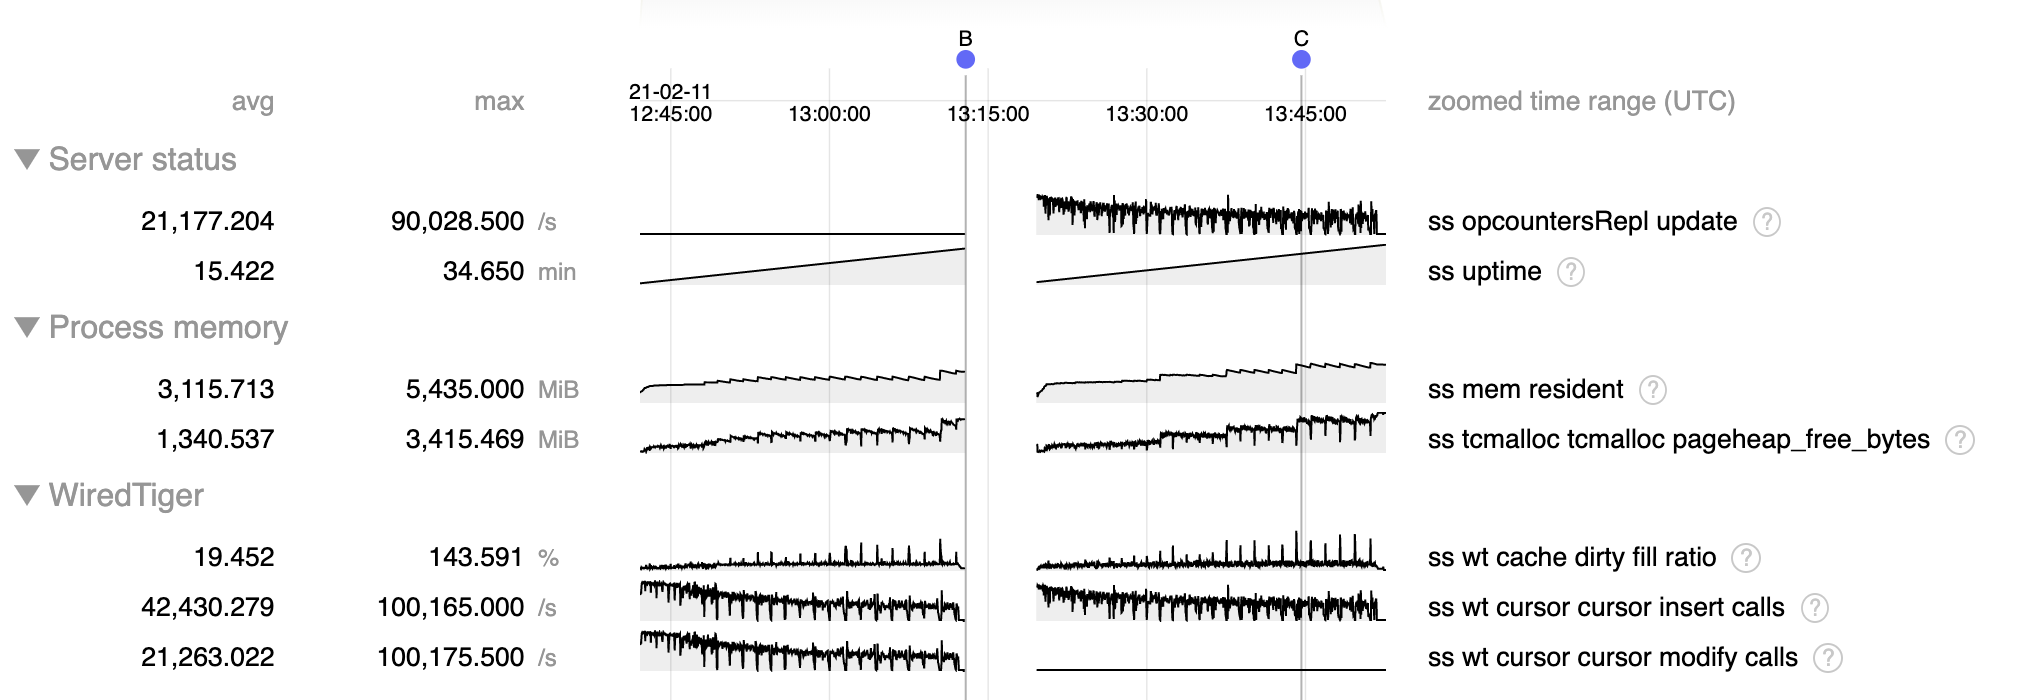
Test (attached) is heavy update workload in PSA replica set, emrc:t, S down, which stresses the history store. Configured with 2 GB cache, which would be typical of a machine with ~4 GB of memory.

- Resident memory usage rises, reaching ~4 GB, at which point I abruptly terminated mongod at B to simulate crash due to OOM that could occur (did not hit actual OOM because was run on a machine with >>4 GB of memory)
- During recovery oplog application after B ("opcountersRepl update") we see a similar (actually somewhat worse) pattern, and would again hit OOM and crash around C, before recovery completes
- Increase in resident memory is due to accumulation of pageheap_free_bytes, indicative of memory fragmentation
- The step function increases in fragmentation occur during checkpoints, when we allow dirty cache content to rise to >140% of configured cache size.
Fragmentation can occurs when a large amount of memory is allocated in small regions, such as update structures associated with dirty content, then is freed but cannot be re-used for large structures such as pages read from disk. We put in place mechanisms to limit this fragmentation by limiting dirty cache to 20% and update structures to 10% of cache, and I suspect that by allowing dirty cache content to greatly exceed these limits we are creating excessive memory fragmentation.
Note that WT-6924 was put into place to eliminate the very large spikes of dirty content we were seeing before to many times the cache size, but I'm not sure why we are still allowing dirty content to entirely fill the cache (and more) rather than limiting it to 20% as we normally do.
- is related to
-
WT-6175 tcmalloc fragmentation is worse in 4.4 with durable history
-
- Closed
-
-
WT-6924 Queue history store pages for urgent eviction when cache pressure is high
-
- Closed
-
-
WT-7168 History store ignores cache size during update heavy workload
-
- Closed
-
- related to
-
WT-7848 Re-enable cache usage check in hs_cleanup_stress and disable hs_cleanup_default
-
- Closed
-


